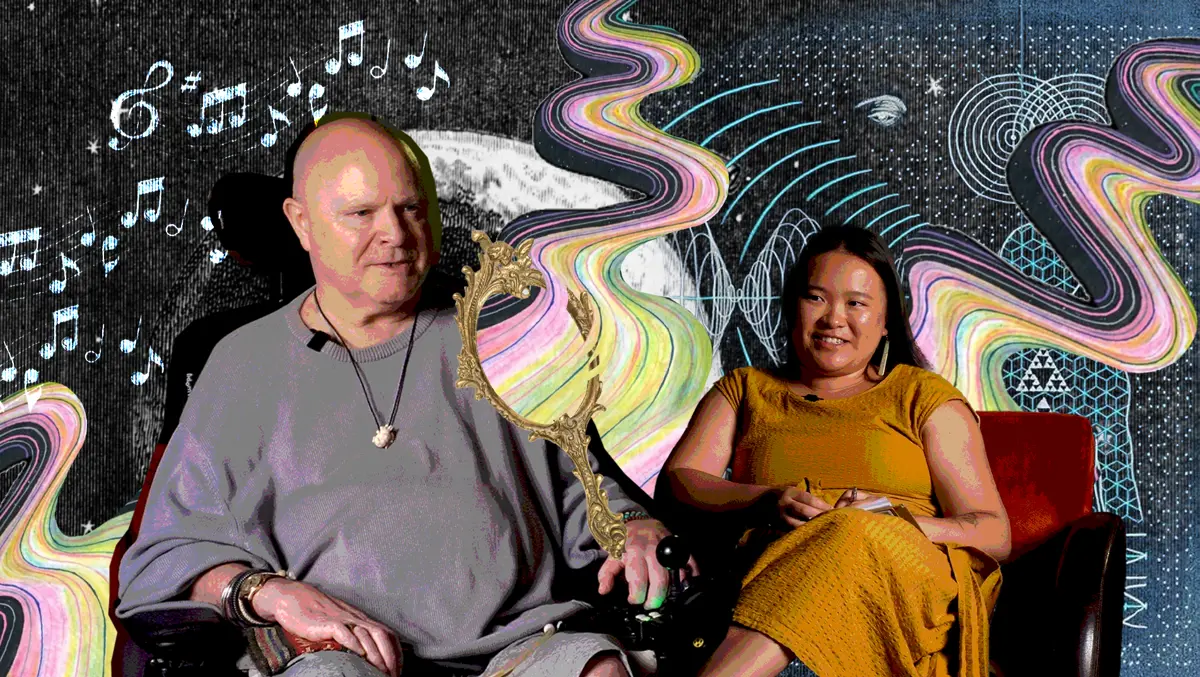
We care about accessibility. If you struggle with colour blindness enable the high contrast mode to improve your experience.
Change the colour scheme of this website to make it easier to read
Disability Survey Web Image

Image description

A hand grabs a slice of watermelon from a cross section divided into six pieces. A wheelchair sits on a slice.

Are we becoming less disabled?

New data estimates 17% of New Zealanders were disabled in 2023, compared to 24% in 2013. Where did the other 200,000 disabled people go?

  • Are we becoming less disabled?
    Eda Tang
    0:00
    |
    0:00
  • Many of us feel proud to be the ‘1 in 4’ living with a disability in Aotearoa. The knowledge that a quarter of New Zealanders share your positionality is a powerful thing and has welcomed those who don’t feel ‘disabled enough’ into the community; it’s allowed our identity to be something beyond suffering and beyond our medical records. 

    But what happens when that statistic is now 1 in 6? It’s important that even though we may be perceived as smaller in this fraction, we still move around the world knowing we’ve got each other’s backs.

    Last Thursday, Stats NZ released the Household Disability Survey 2023 data which estimates that in 2023, 851,000 living in New Zealand households were disabled. Meanwhile, the 2013 version of the survey estimated that 1,062,000 people living in New Zealand were disabled, and it was expected this number would increase due to the ageing population. Where did the other 200,000 disabled people go?

    Of course, we’re still here, we’re just not captured in these statistics. The report itself said that these findings were not comparable to any of the four earlier surveys due to the differences in the survey questions: “For example, a higher threshold was set for counting a person as disabled and this was expected to result in lower disability prevalence in 2023.”

  • It’s important that even though we may be perceived as smaller in this fraction, we still move around the world knowing we’ve got each other’s backs.

  • The latest survey questions are based on something called the “Washington Group Short Set of Questions on Disability”. While the 2013 survey focused on how many people in the country identified as disabled, the newer system is designed to focus on the number of people who are experiencing severe functional difficulty. Although in reality, there isn’t a clear cut line between those disabled and non-disabled, this method does create a binary disability status, and its design captures fewer people as ‘disabled’ than in the 2013 survey. 

    Statistics about functional difficulty are important for understanding needs for that population, the report reads. “The Washington Group’s approach to disability measurement was considered to represent the most appropriate tool for a population survey of this type and the questions used in the 2023 HDS were believed to provide a more useful count of disabled people than those used in previous New Zealand disability surveys.” 

    So to be counted as disabled in the 2023 survey, you need to be one of the top 2 of 4 steps in a question asking about functional difficulty. For example:

    [Without using equipment or support] how much difficulty do you have walking 100 metres on level ground, about the length of a rugby field?
    1. Cannot do at all
    2. A lot of difficulty
    3. Some difficulty
    4. No difficulty 

    Whereas, if you completed the 2013 survey the same question would count those selecting ‘with difficulty’ as disabled:

    1. Not at all
    2. With difficulty
    3. Easily

    So as an example, if you have mid to low level difficulty with doing particular tasks, or experience feelings of depression or anxiety a few times a week, as opposed to every day, you would not be classified as disabled in this data.

    Jonathan Godfrey, Massey University statistics professor and president of Blind Citizens NZ told RNZ: “These people who the system and the questions deem to be disabled [is] not quite the same number as the people who stand up proudly and say ‘I’m disabled'. [These are] the people who are affected by things not working perfectly right in their everyday lives.”

  • These people who the system and the questions deem to be disabled [is] not quite the same number as the people who stand up proudly and say ‘I’m disabled’.

  • “There were plenty of people who… when the last household disability survey results came out, they looked at that number, a touch over 24%, and started scratching their heads and [thinking], ‘Really? Is it really that high?’ And maybe we’ve just got back to a regular level of what it more truthfully looks like today. But we don’t actually know, this is just an estimate.” 

    Some findings shared between the two data sets is that Māori have the highest disability rate, the Auckland population has the lowest disability rate and disability rates increase with age groups. Remembering that the 2023 data speaks to highest functional difficulty (which you could interpret as highest needs), these unwavering findings would suggest that there are equity gaps to be addressed. The 2023 survey also measured the disability rate within those who identify as LGBTIQ+*: something not measured in the 2013 data. It found that the disability rate of 29% within this population was significantly higher than the rate of those not identifying (17%). 

    This data is helpful in knowing how to allocate disability funding resources – when the resources are there, that is. The two surveys can’t be meaningfully compared to one another, but that doesn’t change the optics that disabled people are now represented as 1 in 6, rather than 1 in 4. The layperson won’t know why the number is smaller, but in politics we need the buy-in of as many people as possible. Will this number still sound as important when politicians and newsmakers use figures to illustrate the importance of disability issues? 

    For us at The D*List, the social and personal identity of being disabled enables us to proudly do our work. For some of us, being disabled is an acquired reality and identity after an injury or the development of a chronic illness. Some of us were born with disabilities which may have been passed down intergenerationally, so the identity is something we’ve known our whole lives. And some of us may also have some discomfort around identifying as disabled especially if we present as able-bodied or have dynamic disabilities. All of these are captured in the social identity of disability, but not all will be captured by the Washington Group method. 

    Just as “1 in 4” may have arbitrarily represented our social identity, so should we let this new fraction represent us as a community. We must see this data as “1 in 6 people live with at least a lot of difficulty in everyday functioning” rather than the sum total of our community.

    *wording used by Stats NZ, although our preference is LGBTQIA+


  • Subscribe to our weekly newsletter, The D*List Delivered!

Related